Monitoring Kubernetes with Popeye, Prometheus & Grafana
TL;DR
Popeye is a utility that scans live Kubernetes clusters and reports potential issues with deployed resources and configurations.
I set up Popeye to scan my K3s cluster and visualize results in Grafana using Pushgateway. Total setup time: ~30 minutes.
My Setup
- Bare Metal: Ubuntu 24.04 LTS
- Cluster: K3s (single node test cluster)
- Monitoring stack: Prometheus Operator + Grafana (already deployed via helm Chart kube-prometheus-stack-79.5.0)
Installation
1. Install Popeye on the server
There are multiple ways to install Popeye (binary, Docker, Homebrew). Check the official Popeye GitHub for all options.
I went with the Debian package:
wget https://github.com/derailed/popeye/releases/download/v0.22.1/popeye_linux_amd64.deb
dpkg -i popeye_linux_amd64.deb
mv popeye /usr/local/bin/
chmod +x /usr/local/bin/popeye
2. Deploy Pushgateway in Kubernetes
Created a simple deployment:
Note:
Pushgateway = Temporary storage for metrics from short-lived jobs
The Problem:
Prometheus pulls (scrapes) metrics from targets. But what if your job finishes before Prometheus can scrape it?
Pushgateway acts as a buffer:
- Short-lived job (like Popeye scan) → Pushes metrics to Pushgateway
- Pushgateway → Stores the metrics temporarily
- Prometheus → Scrapes from Pushgateway (normal pull)
apiVersion: apps/v1
kind: Deployment
metadata:
  name: prometheus-pushgateway
  namespace: monitoring
spec:
  replicas: 1
  selector:
    matchLabels:
      app: pushgateway
  template:
    metadata:
      labels:
        app: pushgateway
    spec:
      containers:
      - name: pushgateway
        image: prom/pushgateway:v1.9.0
        ports:
        - containerPort: 9091
---
apiVersion: v1
kind: Service
metadata:
  name: prometheus-pushgateway
  namespace: monitoring
  labels:
    app: pushgateway
spec:
  type: ClusterIP
  ports:
  - port: 9091
    targetPort: 9091
  selector:
    app: pushgateway
---
apiVersion: monitoring.coreos.com/v1
kind: ServiceMonitor
metadata:
  name: pushgateway
  namespace: monitoring
  labels:
    app: pushgateway
spec:
  selector:
    matchLabels:
      app: pushgateway
  endpoints:
  - port: http
    interval: 30s
    honorLabels: true
Applied with:
kubectl apply -f pushgateway-deployment.yaml3. Verify Connectivity
Since I have a K3s setup, I am allowed direct ClusterIP access (I am already on the K3S node).
kubectl get svc -n monitoring prometheus-pushgateway
# prometheus-pushgateway   ClusterIP   10.43.228.37   <none>   9091/TCP

curl http://10.43.228.37:9091/-/healthy
# OK
Critical step: Ensure the Service has the correct label for the ServiceMonitor to match:
ServiceMonitor uses selector (filtre) to find the service it needs to scrap
(base) root@YodaLinux:~# kubectl get svc prometheus-pushgateway -n monitoring --show-labels
NAME                     TYPE        CLUSTER-IP     EXTERNAL-IP   PORT(S)    AGE    LABELS
prometheus-pushgateway   ClusterIP   10.43.228.37   <none>        9091/TCP   2d9h   app=pushgateway
ServiceMonitor:
  selector:
    matchLabels:
      app: pushgateway
4. Run Popeye and Push Metrics
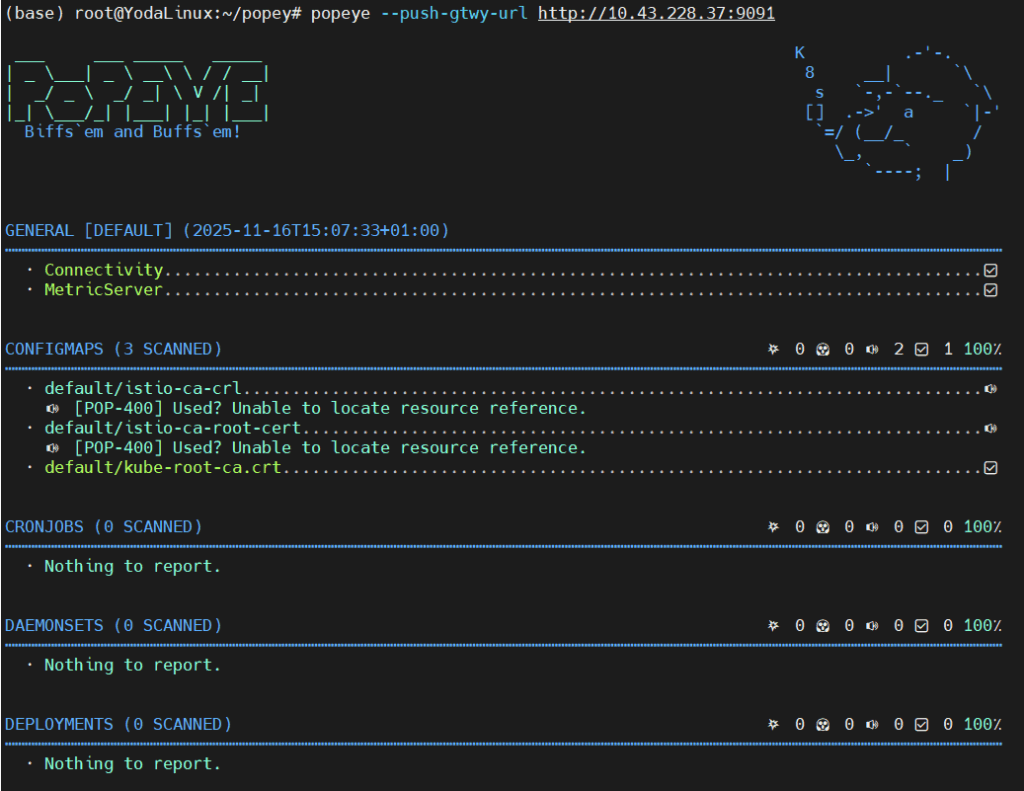
popeye --push-gtwy-url http://10.43.228.37:9091
5. Verify Prometheus Scraping
Status > Targets → pushgateway status: UP

Tested few Promql queries (optional):

6. Grafana Dashboard
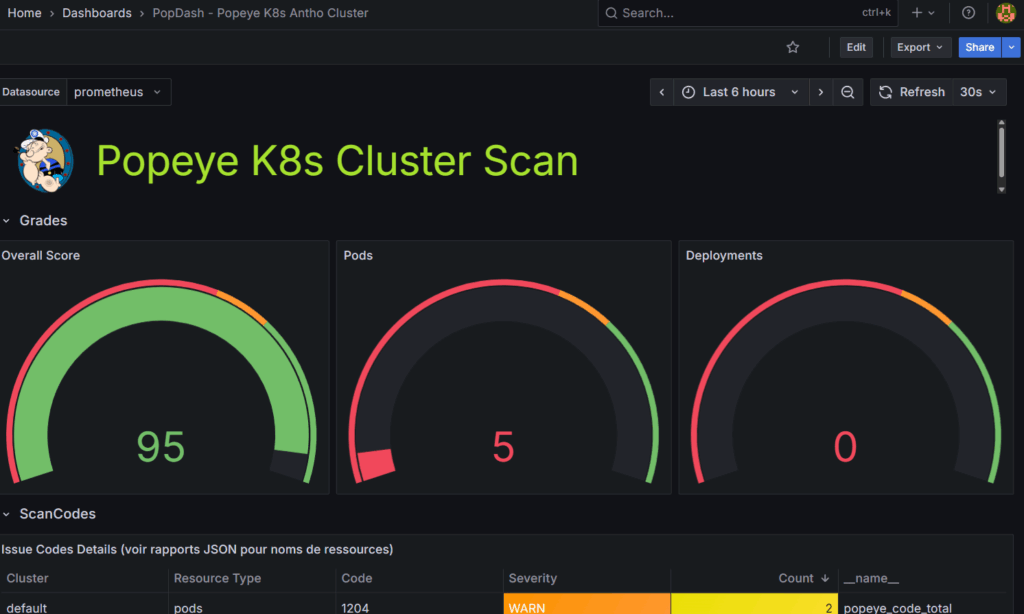
I used Claude (Sonnet 4.5) to create a custom dashboard which almost matched the official Popeye dashboard style (I could not find the dashboard). The dashboard includes:
- Overall cluster score gauge
- Detailed breakdowns by linter (pods, deployments, services)
- Error/Warning/Info tables with color-coded severity
- Expandable sections for scan codes and severities
You can find my dashboard here: https://github.com/cuspofaries/popey-grafana-dashboard/blob/main/popey-grafana-dashboard-fr
Import the JSON in Grafana: Dashboards >New > Import > Upload JSON
The dashboard auto-refreshes every 30 seconds.

7. Automate Scanning
Added to crontab:
# Scan every 30 minutes
*/30 * * * * popeye --push-gtwy-url http://10.43.228.37:9091
8. Alerting suggestions (Optional – not tested)
Create PrometheusRule for basic alerts:
apiVersion: monitoring.coreos.com/v1
kind: PrometheusRule
metadata:
  name: popeye-alerts
  namespace: monitoring
spec:
  groups:
  - name: popeye.rules
    interval: 5m
    rules:
    - alert: PopeyeClusterScoreLow
      expr: popeye_cluster_score < 60
      for: 15m
      labels:
        severity: warning
      annotations:
        summary: "Cluster score below 60"

    - alert: PopeyeTooManyErrors
      expr: popeye_report_errors_total > 10
      for: 10m
      labels:
        severity: critical
      annotations:
        summary: "Too many errors detected"


![Understanding Karpenter’s Node Consolidation [EKS]: A Deep Dive](https://devopsmotion.com/wp-content/uploads/2024/12/1589294377f_-x_b_w_david_reckert-768x1024.jpg)